
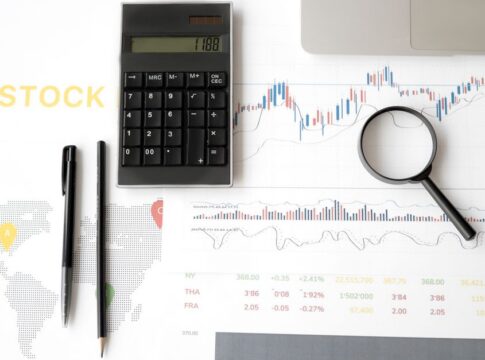
Stock Market Volatility: Why Prices Swing and What It Means
By Newsroom, Business Desk — Published August 6, 2026
Table of Contents
- What Drives Stock Market Volatility?
- The Mechanics of Market Swings
- Volatility Across Different Market Segments
- What Volatility Means for the Broader Economy
- Frequently Asked Questions
Stock market volatility — the rapid and often unpredictable movement of share prices up and down — can unsettle even experienced investors. One day the market soars on optimism; the next, it plunges on fear. Understanding why this happens, and what it signals about the broader economy, helps citizens make sense of their retirement accounts, economic news, and the financial forces shaping daily life.
Volatility isn’t inherently good or bad. It’s a measure of uncertainty, reflecting how quickly and dramatically investors change their minds about what companies and entire economies are worth. Some swings stem from concrete data — quarterly earnings reports, inflation data, or interest rate decisions. Others arise from sentiment, geopolitical shocks, or herd behavior. Either way, these fluctuations ripple through pension funds, consumer confidence, and business investment decisions.
What Drives Stock Market Volatility?
Markets move when expectations shift. Stock prices represent collective bets on future profits. When new information arrives — a company’s earnings beat forecasts, unemployment statistics surprise economists, or the Federal Reserve signals a policy change — investors recalibrate. The speed and scale of that recalibration determine volatility.
Economic indicators carry enormous weight. Inflation data can trigger sell-offs if investors fear rising prices will erode corporate margins or prompt central banks to raise borrowing costs. GDP growth rate announcements influence expectations about consumer spending and business expansion. Strong growth typically lifts stocks; weak growth raises recession fears. Interest rate decisions by the Federal Reserve directly affect the discount rate investors use to value future earnings. Higher rates make bonds more attractive relative to stocks, often pulling money out of equities.
Corporate performance matters just as much. Quarterly earnings reports arrive in waves each season, revealing whether companies met, exceeded, or fell short of Wall Street’s expectations. A single disappointing report from a major technology firm can drag down an entire sector. Supply chain disruptions — whether from natural disasters, trade disputes, or pandemic-related factory closures — can suddenly slash revenue forecasts and spark price drops.
Geopolitical events inject unpredictability. Trade deficit announcements, tariff threats, or international conflicts can shift investor sentiment overnight. Markets hate uncertainty. When the rules governing global commerce or political stability come into question, traders often sell first and ask questions later.
The Mechanics of Market Swings
Modern markets amplify volatility through speed and structure. Algorithmic trading systems execute millions of transactions per second, reacting to price movements faster than any human could. When these programs detect downward momentum, they may trigger automatic sell orders, accelerating declines. The same mechanism works in reverse during rallies.
Leverage magnifies the effect. Investors who borrow money to buy stocks — or use derivatives to amplify their bets — can be forced to sell when prices move against them, creating cascading pressure. Margin calls, where brokers demand additional cash from leveraged investors, can turn a modest dip into a rout.
Market structure itself contributes. Circuit breakers pause trading during extreme moves to prevent panic, but the knowledge that these safeguards exist can paradoxically encourage risk-taking. Index funds and exchange-traded funds, which automatically track baskets of stocks, now dominate trading volume. When investors flee these funds, selling hits all constituent stocks simultaneously, regardless of individual company fundamentals.
Volatility Across Different Market Segments
Not all sectors experience volatility equally. Technology stocks, particularly those without profits but high growth expectations, tend to swing more dramatically than utilities or consumer staples. Venture capital funding patterns influence this dynamic — when capital flows freely into startups and speculative ventures, valuations can detach from earnings, creating fragility.
Cryptocurrency markets have introduced new volatility vectors. Digital assets trade around the clock across global exchanges with varying degrees of regulation. Price movements in these markets sometimes spill over into traditional equities, particularly for companies with significant cryptocurrency holdings or blockchain exposure.
Real estate investment trusts and housing market indicators create another volatility channel. Interest rate decisions hit these sectors especially hard, since property values and mortgage costs move inversely to rates. Employment trends and labor markets feed back into housing demand, creating complex interdependencies.
Key Factors That Amplify or Dampen Volatility
- Liquidity conditions: When markets have many buyers and sellers, large orders can execute without moving prices much. Thin markets exaggerate swings.
- Investor positioning: If most traders already hold similar positions, even minor news can trigger mass exits with no one willing to buy.
- Policy clarity: Clear guidance from central banks and regulators reduces uncertainty; ambiguous signals heighten it.
- Corporate transparency: Companies that communicate clearly about challenges and strategies tend to experience less dramatic reactions to setbacks.
- Media amplification: Sensational coverage can accelerate panic or euphoria, pushing prices beyond levels justified by fundamentals.
What Volatility Means for the Broader Economy
Stock market gyrations affect more than investors. Retirement accounts tied to equity markets see balances swing, influencing how secure workers feel about their futures. Consumer spending patterns often follow market trends — people spend more freely when portfolios rise and pull back when values drop, even if their day-to-day income hasn’t changed.
Business investment decisions respond to market signals. Companies planning expansions or mergers and acquisitions watch their stock prices closely. Depressed valuations make raising capital expensive and can shelve growth plans. Conversely, buoyant markets encourage risk-taking and deal-making.
The wealth effect extends beyond individual psychology. Municipalities and states with pension funds heavily invested in equities face budget pressures when markets tumble. A sustained downturn can force cuts to public services or higher contributions from taxpayers to shore up retirement obligations.
Employment trends connect to market volatility through multiple channels. Companies flush with cash from rising stock prices often hire and invest; those watching share values crater may freeze hiring or cut staff. Layoffs in the financial sector during volatile periods ripple through local economies, affecting everything from retail sales to real estate demand.
Frequently Asked Questions
How is stock market volatility measured?
The most common measure is the VIX, often called the “fear index,” which tracks expected volatility based on options prices for the S&P 500. Historical volatility looks backward at actual price movements over a set period. Both approaches help investors gauge how much uncertainty the market is pricing in. A VIX reading above 20 typically signals elevated anxiety; below 12 suggests calm conditions.
Does high volatility always mean the market will crash?
No. Volatility measures the magnitude of price swings, not their direction. Markets can be volatile during both rallies and sell-offs. Periods of high volatility often cluster around major economic transitions — recoveries from recessions can be just as volatile as downturns. What volatility does signal is disagreement among investors about where prices should go, which creates opportunity and risk simultaneously.
Should ordinary investors try to time the market based on volatility?
Most financial advisors caution against this strategy. Academic research consistently shows that missing just a handful of the market’s best days — which often occur during volatile periods — dramatically reduces long-term returns. For retirement savers with decades until they need the money, volatility is better viewed as a feature of markets rather than a signal to trade. Dollar-cost averaging, where investors contribute fixed amounts regularly regardless of market conditions, can actually benefit from volatility by purchasing more shares when prices dip.
How do supply chain disruptions translate into stock volatility?
When manufacturers can’t get components or retailers face empty shelves, revenue forecasts collapse. Investors must suddenly recalculate what companies can earn, often with incomplete information. The uncertainty itself drives volatility — different analysts reach different conclusions, leading to wide bid-ask spreads and rapid price discovery. Companies with global operations face compounded risk, since disruptions can cascade across borders. The resulting volatility often spreads beyond directly affected firms to entire industries as investors reassess which business models prove resilient.
Volatility is the market’s way of processing change and uncertainty. While unsettling, these swings reflect millions of participants continuously weighing new information against old assumptions. For citizens watching their savings fluctuate, understanding the forces behind the movement — from interest rate decisions to quarterly earnings surprises — makes the experience less mysterious and more manageable. The key is recognizing that volatility, like economic cycles themselves, is a permanent feature of market-based systems rather than a malfunction to be feared.