
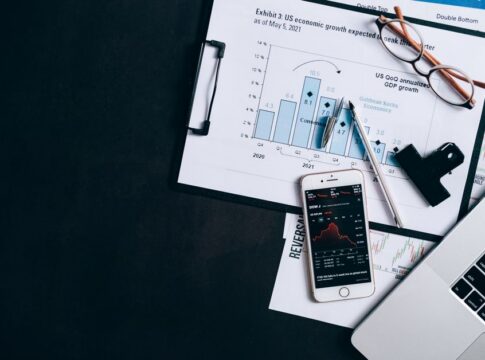
GDP Growth Rate: How Economists Measure Economic Health
By Newsroom, Business Desk — Published August 6, 2026
Table of Contents
- The Mechanics Behind the Measurement
- What Moves the Needle
- The Gaps and Blind Spots
- Why Markets and Policymakers Watch Closely
- Frequently Asked Questions
When policymakers debate interest rate decisions or analysts forecast stock market volatility, they’re often reacting to a single number: the GDP growth rate. Growth rate economists rely on this figure as the primary thermometer for the economy’s overall health, yet most citizens encounter it only as a headline statistic stripped of context. Understanding what this number actually measures—and what it misses—matters for anyone trying to make sense of inflation data, unemployment statistics, or why their grocery bills keep climbing despite reports of economic expansion.
Gross Domestic Product represents the total market value of all finished goods and services produced within a country’s borders during a specific period. The growth rate simply tracks how much that total changed compared to the previous quarter or year. A positive rate signals expansion; a negative rate indicates contraction. Two consecutive quarters of negative growth typically define a recession, though that’s a rule of thumb rather than an official designation.
The Mechanics Behind the Measurement
Economists calculate GDP using three different approaches that should theoretically yield the same result. The expenditure method adds up all spending: consumer purchases, business investments, government expenditures, and net exports (exports minus imports). The income method totals all earnings—wages, profits, rents, and taxes minus subsidies. The production method sums the value added at each stage of production across all industries.
Most countries, including the United States, rely primarily on the expenditure approach because spending data arrives more quickly than comprehensive income figures. The Bureau of Economic Analysis releases an advance estimate roughly one month after each quarter ends, followed by two revisions as more complete information becomes available. These revisions can be substantial. What initially appeared as modest growth might later be revised downward to show contraction, or vice versa.
The quarterly figures get reported as annualized rates—what the growth would be if that quarter’s pace continued for a full year. This creates confusion. A reported 2.4 percent annual rate doesn’t mean the economy actually grew 2.4 percent that quarter; it grew roughly 0.6 percent, which projects to 2.4 percent annually. Comparing year-over-year growth offers a clearer picture by measuring against the same quarter in the previous year, smoothing out seasonal fluctuations.
What Moves the Needle
Consumer spending drives roughly two-thirds of GDP in developed economies. When households feel confident about employment prospects and wage growth, they spend more on everything from housing to entertainment. Supply chain disruptions can throttle this spending by limiting product availability or pushing prices higher, forcing consumers to cut back elsewhere. Quarterly earnings reports from major retailers often provide early signals about consumption trends before official GDP data arrives.
Business investment forms another critical component. Companies expand facilities, purchase equipment, and build inventory when they anticipate future demand. Venture capital funding flows and corporate strategy around mergers and acquisitions reflect business confidence. When interest rates rise, borrowing costs increase, often dampening investment appetite. The Federal Reserve watches GDP growth closely when making interest rate decisions, trying to calibrate policy to sustain expansion without overheating into runaway inflation.
Government spending adds another layer, from defense contracts to infrastructure projects to social programs. Trade balances matter too. A widening trade deficit—importing more than exporting—subtracts from GDP growth, even if those imports reflect strong domestic demand and purchasing power. Currency fluctuations, tariff policies, and global economic conditions all influence this component.
The Gaps and Blind Spots
GDP growth measures market transactions, which means substantial economic activity falls outside its scope. Unpaid household labor, volunteer work, and the informal economy don’t register. Environmental degradation might boost GDP if it spurs cleanup spending, even though the net effect harms societal wellbeing. A hurricane that destroys homes shows up as economic growth when reconstruction begins, despite representing a loss.
The figure also says nothing about distribution. An economy can post strong GDP growth while inequality widens, with gains concentrated among high earners while middle-class wages stagnate. Two countries with identical growth rates might offer vastly different lived experiences for typical residents. Unemployment statistics provide one corrective lens, showing whether growth translates into job creation. Real wage data—adjusted for inflation—reveals whether workers can actually buy more with their paychecks.
Inflation complicates the picture significantly. Nominal GDP measures output at current prices, so rising prices inflate the number even if physical production stays flat. Real GDP adjusts for price changes, offering a more accurate picture of actual output growth. The gap between nominal and real growth reflects inflation’s impact. When inflation data shows prices rising faster than real GDP grows, living standards decline despite positive headline growth.
Key Limitations of GDP as a Measure
- Excludes non-market activities like household labor and volunteer work
- Treats environmental costs and natural disasters as economic positives when cleanup occurs
- Provides no information about income distribution or inequality
- Can be distorted by price changes, requiring inflation adjustments for accuracy
- Measures activity rather than wellbeing or quality of life
- Subject to significant revisions as more complete data becomes available
Why Markets and Policymakers Watch Closely
Stock market volatility often follows GDP releases that surprise expectations. Stronger-than-expected growth might signal corporate profit potential, boosting equities. But it could also prompt Federal Reserve concern about inflation, raising the prospect of interest rate hikes that make bonds more attractive and stocks less so. Weaker growth might depress stock prices on recession fears, or lift them if investors anticipate easier monetary policy ahead.
The Federal Reserve explicitly considers GDP growth when setting monetary policy. The central bank aims for maximum employment and stable prices—goals that require sustained but moderate growth. Too fast, and inflation accelerates as demand outstrips supply. Too slow, and unemployment rises as businesses contract. Interest rate decisions attempt to keep growth in a “Goldilocks” zone, though determining the right pace involves more art than science.
Real estate and housing markets respond to the interplay between GDP growth, employment trends, and interest rates. Strong economic expansion typically boosts housing demand as household formation increases and incomes rise. But if growth prompts rate hikes, mortgage costs climb, potentially cooling the market. Consumer spending patterns shift accordingly—a housing boom redirects money toward furnishings and renovations; a bust frees spending for other categories.
International investors and currency traders parse GDP data to assess relative economic strength. Faster growth in one country versus another can drive capital flows and exchange rate movements. Multinational corporations factor growth forecasts into decisions about where to expand operations or source products, influencing both domestic investment and trade flows.
Frequently Asked Questions
What’s considered a healthy GDP growth rate?
Most developed economies target annual growth between 2 and 3 percent as sustainable over the long term. Faster rates risk overheating and inflation, while slower growth may not create enough jobs to absorb new workforce entrants. Developing economies often post higher rates—sometimes 5 to 7 percent—as they catch up technologically and industrialize. Context matters: growth of 1 percent might be worrying during an expansion but welcome during recovery from a deep recession.
How does GDP growth differ from stock market performance?
GDP measures the entire economy’s output, while stock prices reflect expectations about corporate profits, which represent just one slice of economic activity. Markets can rally during slow GDP growth if investors expect conditions to improve, or fall during solid growth if they fear an imminent slowdown. Stock performance also depends on interest rates, global conditions, and investor sentiment—factors that don’t always align with domestic GDP trends. Over very long periods, the two tend to correlate, but short-term divergences are common.
Can an economy have positive GDP growth but rising unemployment?
Yes, particularly during the early stages of recovery. Businesses may increase output through productivity improvements—getting more from existing workers—before hiring additional staff. Population growth can also expand the labor force faster than job creation, pushing unemployment higher despite economic expansion. The relationship between growth and employment, known as Okun’s Law, suggests GDP must grow above a certain threshold—often around 2 to 3 percent—to reduce unemployment. Below that, joblessness can rise even with positive growth.
Why do GDP figures get revised months after initial release?
The advance estimate relies on incomplete data because comprehensive information takes time to collect and verify. Initial figures might be based on surveys covering 60 or 70 percent of economic activity, with the rest estimated. As tax returns arrive, trade data firms up, and businesses file detailed reports, statisticians incorporate better information. Major revisions sometimes occur years later during benchmark updates that incorporate new methodologies or data sources. This lag between economic reality and measurement means policymakers often react to outdated information.
The GDP growth rate remains the single most watched economic indicator despite its flaws because it captures the economy’s overall direction in one comparable number. No metric tells the whole story. Wise interpretation requires looking at GDP alongside employment data, inflation figures, wage trends, and inequality measures. The number itself is just a starting point for understanding whether the economy works for ordinary people, not an endpoint.