
GDP Growth Rate Explained: How Economic Output Is Measured
By Newsroom, Business Desk — Published August 14, 2026
Table of Contents
- What the Growth Rate Actually Measures
- Nominal Versus Real: Why Inflation Data Matters
- How Quarterly Reports Shape Market Expectations
- Limitations and What GDP Doesn’t Capture
- The Connection to Employment and Wages
- Frequently Asked Questions
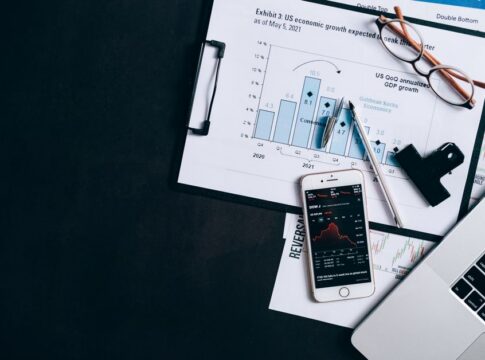
When the Federal Reserve adjusts interest rates or investors react to quarterly earnings reports, one number often sits at the center of the conversation: the GDP growth rate. This figure—a percentage that tells us whether the economy expanded or contracted over a given period—shapes everything from stock market volatility to unemployment statistics. But what exactly does GDP growth rate explained mean for the average person, and how do economists arrive at this closely watched metric?
Gross Domestic Product measures the total value of all goods and services produced within a country’s borders during a specific timeframe. The growth rate, then, captures how much that output increased or decreased compared to an earlier period, typically quarter-to-quarter or year-over-year. A rising GDP suggests more jobs, higher incomes, and expanding business activity. A shrinking one signals recession and economic pain.
What the Growth Rate Actually Measures
At its simplest, GDP growth rate reflects the percentage change in economic output. If an economy produced the equivalent of $20 trillion in goods and services last year and $20.4 trillion this year, the growth rate would be 2 percent. But calculating that figure requires far more than simple arithmetic.
Economists track four main components: consumer spending, business investment, government expenditure, and net exports (the difference between what a country sells abroad and what it imports, often called the trade deficit when negative). Consumer spending typically dominates, accounting for roughly two-thirds of GDP in many developed economies. When households buy cars, pay for healthcare, or order takeout, they’re contributing to this massive category.
Business investment covers everything from factory equipment to software purchases to new construction. Government spending includes salaries for public employees, military hardware, and infrastructure projects. Net exports add the value of goods shipped overseas while subtracting imports—a figure that can swing dramatically based on supply chain disruptions or shifting trade relationships.
The growth rate emerges by comparing these totals across time periods. But there’s a catch: raw numbers don’t account for inflation. A 5 percent increase in GDP might sound impressive until you realize prices also rose 4 percent, leaving only 1 percent of “real” growth.
Nominal Versus Real: Why Inflation Data Matters
This distinction between nominal and real GDP sits at the heart of accurate economic measurement. Nominal GDP uses current prices—the actual dollars changing hands today. Real GDP adjusts for inflation, stripping out price increases to reveal whether the economy actually produced more stuff or simply charged more for the same amount.
Imagine a simple economy that produces only smartphones. Last year it made 100 phones at $500 each, for a nominal GDP of $50,000. This year it made 105 phones at $550 each, for a nominal GDP of $57,750. The nominal growth rate would be 15.5 percent. But if we adjust for the $50 price increase per phone, real GDP only grew from 100 to 105 units—a real growth rate of 5 percent.
This adjustment process uses a price index, typically comparing current prices to a base year. Without it, an economy could appear to be booming simply because inflation ran hot. That’s why headlines about GDP growth almost always refer to the real rate, and why the Bureau of Economic Analysis (the U.S. agency responsible for GDP statistics) publishes both figures.
The relationship between GDP growth, inflation data, and interest rate decisions forms a critical feedback loop. When real growth accelerates too quickly, inflation often follows as demand outpaces supply. Central banks may then raise interest rates to cool things down, which can slow business investment and consumer borrowing.
How Quarterly Reports Shape Market Expectations
GDP figures arrive on a quarterly schedule, but they don’t appear all at once. The initial “advance” estimate comes about a month after the quarter ends, followed by two revisions as more complete data rolls in. This staggered release creates opportunities for stock market volatility, especially when the numbers surprise analysts.
Investors parse these reports alongside quarterly earnings reports from major corporations. Strong GDP growth typically suggests healthy revenue conditions for businesses, though the details matter enormously. Growth driven by consumer spending might boost retailers and restaurants. Growth fueled by business investment could benefit equipment manufacturers and enterprise software companies. A surge in net exports might reflect currency fluctuations or new trade agreements rather than fundamental strength.
The composition of growth also signals where the economy might head next. Rapid increases in business inventories, for instance, can inflate GDP in one quarter but lead to cutbacks later if those goods don’t sell. Government spending can provide a temporary lift without indicating sustainable private-sector momentum. Venture capital funding often flows toward sectors showing strong growth potential, creating another layer of market response to GDP trends.
Limitations and What GDP Doesn’t Capture
For all its influence, GDP has significant blind spots. It counts market transactions but misses unpaid work—childcare, volunteer efforts, household labor. It treats natural resource depletion as income rather than a balance sheet loss. Environmental damage doesn’t subtract from GDP; cleanup spending actually adds to it.
The metric also says nothing about distribution. An economy might post 3 percent growth while most gains flow to a narrow slice of households, leaving median incomes stagnant. GDP doesn’t measure quality of life, leisure time, or job satisfaction. A country could boost its growth rate by having people work longer hours in more stressful conditions, which might not represent genuine progress.
Some of these concerns have sparked interest in alternative measures—Gross National Happiness, the Human Development Index, measures of income inequality. But GDP’s advantages keep it central: it’s measurable, comparable across countries, and updated frequently. Policymakers and markets need timely data, even if imperfect.
Understanding these limitations helps interpret the numbers more wisely. A slowdown in GDP growth might coincide with improvements in work-life balance or environmental quality that don’t show up in the statistics. Conversely, rapid growth might mask rising inequality or unsustainable resource use.
The Connection to Employment and Wages
GDP growth and unemployment statistics move in rough tandem, though not in lockstep. When output expands, businesses typically need more workers, pushing unemployment down. When growth stalls or reverses, layoffs follow. This relationship, sometimes called Okun’s Law, suggests that each percentage point of GDP growth above the economy’s trend rate reduces unemployment by about half a percentage point.
But the connection isn’t mechanical. Productivity improvements let companies produce more with the same workforce. Automation can boost GDP while eliminating jobs. The types of jobs created matter too—an economy generating low-wage service positions looks different from one adding high-skill manufacturing roles, even if the headline growth rate matches.
Wage growth adds another dimension. Strong GDP growth should eventually translate into higher pay as employers compete for workers. Yet that transmission can be slow and uneven, depending on labor market conditions, union strength, minimum wage policies, and workers’ bargaining power. Real estate and housing markets often respond to both GDP growth and employment trends, as rising incomes fuel demand for homes while construction activity feeds back into GDP.
Frequently Asked Questions
How often is GDP growth calculated and reported?
GDP growth is calculated quarterly in most developed economies, with annual figures derived from those quarterly totals. In the United States, the Bureau of Economic Analysis releases an advance estimate roughly one month after each quarter ends, followed by two subsequent revisions as more complete source data becomes available. Many countries also publish monthly indicators that offer clues about GDP trends before the official quarterly numbers arrive.
What’s considered a healthy GDP growth rate?
The answer depends on the country’s stage of development and structural characteristics. Developed economies typically target 2 to 3 percent annual real growth as sustainable over the long term—enough to create jobs and rising living standards without overheating into inflation. Emerging economies often grow faster, sometimes 5 to 7 percent or more, as they catch up technologically and build infrastructure. Growth significantly below these ranges may signal stagnation, while rates far above can indicate unsustainable booms.
Can GDP growth be negative, and what does that mean?
Yes, negative GDP growth means the economy produced less than in the previous period—economic contraction rather than expansion. Two consecutive quarters of negative growth typically define a recession, though official recession dating considers additional factors like employment, income, and industrial production. Negative growth usually brings rising unemployment, falling incomes, and declining business profits, creating a self-reinforcing cycle that requires policy intervention to reverse.
How do international trade and the trade deficit affect GDP growth?
Net exports—exports minus imports—form one component of GDP, so changes in trade balances directly affect the growth calculation. A widening trade deficit (more imports than exports) subtracts from GDP growth in the accounting sense, though the economic significance is complex. Imports might reflect strong consumer demand and business investment, both positive signs. Exports can boost growth but depend on foreign economic conditions and exchange rates. Trade disruptions, whether from tariffs, supply chain problems, or shifting global demand, create volatility in this component and complicate growth forecasts.
The GDP growth rate remains the single most watched gauge of economic health, despite its imperfections. Understanding how it’s calculated, what drives changes, and where it falls short helps citizens make sense of policy debates, investment decisions, and their own economic prospects. The number matters—but so does the story behind it.